Featured Data
The Global Nitrous Oxide Database
January 1, 2022
Susanne Grossman-Clarke
Citation
Dorich, C.D., R.T. Conant, and D. Wang. 2021. Global N2O Database version 1.0 ver 1. Environmental Data Initiative. https://doi.org/10.6073/pasta/09a95cf44cd7835db002b0089ed5ffc3.
Description
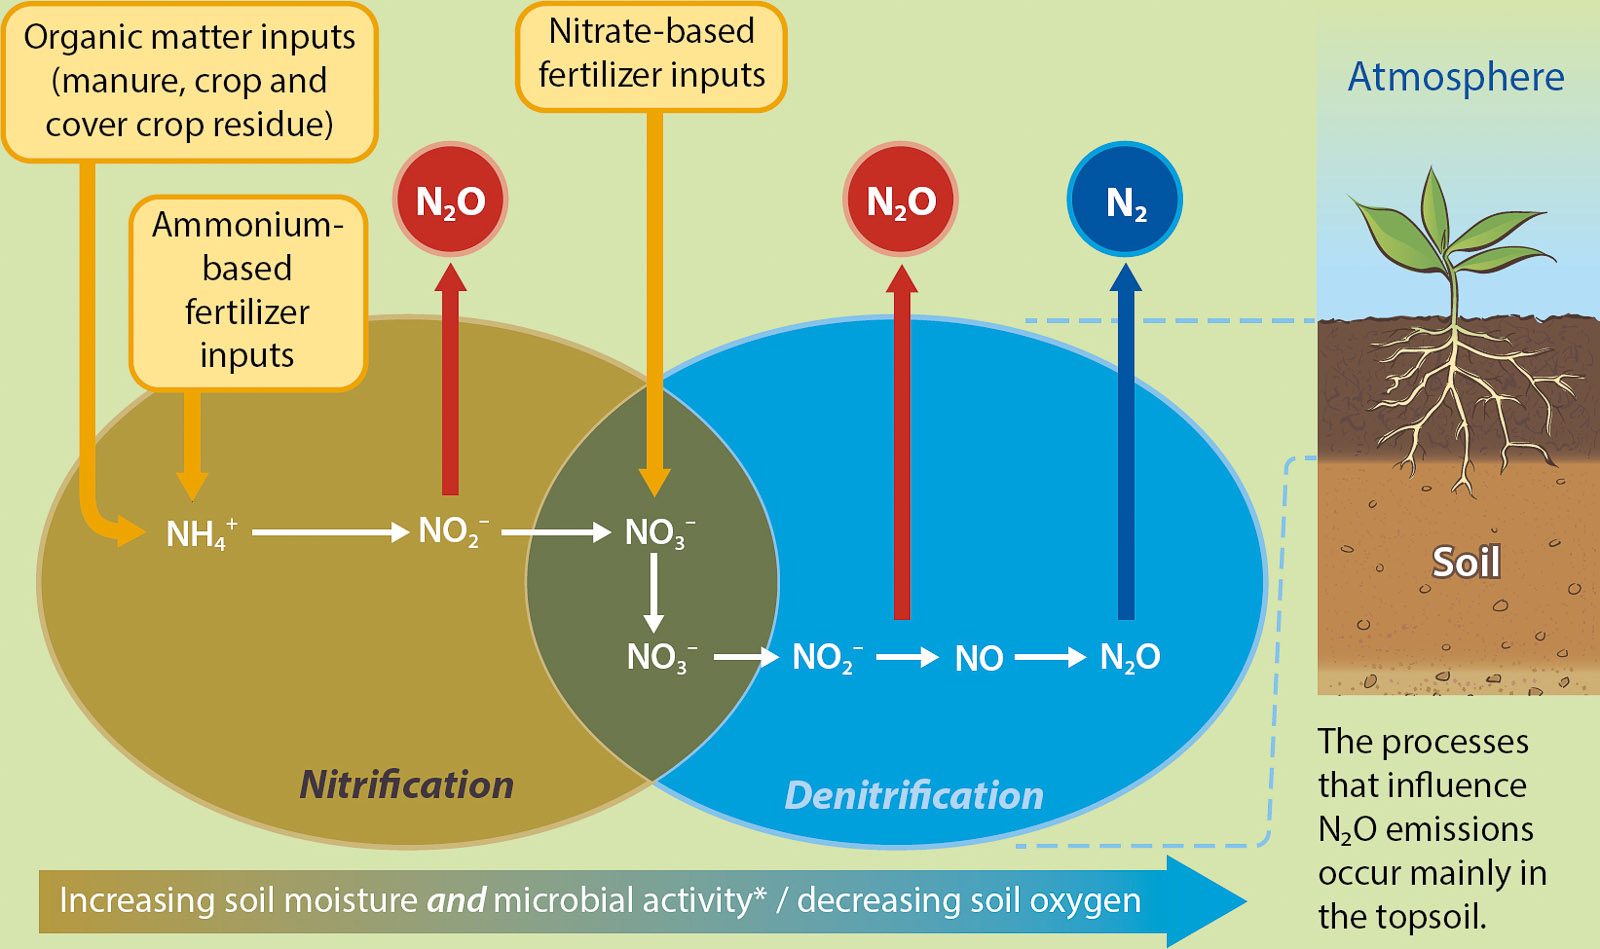
This featured data package contains data on nitrous oxide (N2O) emissions (Fig. 1) as well as covariate data such as climate data, soil moisture and temperature, soil inorganic nitrogen, crop yields and other greenhouse gas emissions (methane, carbon dioxide) from experimental agricultural sites whose data are deposited in the Global Nitrous Oxide Database.
The data package is a great example of making the content of an open database publicly available through EDI, with the intention of allowing easy access to the data for researchers. This will support studies that advance scientific understanding of N2O emissions in food production as well as their mitigation. For publication in EDI, the data of the various experimental studies in the database have been converted to the same format and concatenated. EDI 2020 Fellow Sydney Lewis (Undergraduate student in Marine Science at the University of Hawaii, Hilo) contributed to the data publication under the guidance of her mentor Chris Dorich, Research Associate at the Natural Resource Ecology Laboratory (NREL), Colorado State University (CSU).
The Global N2O Database
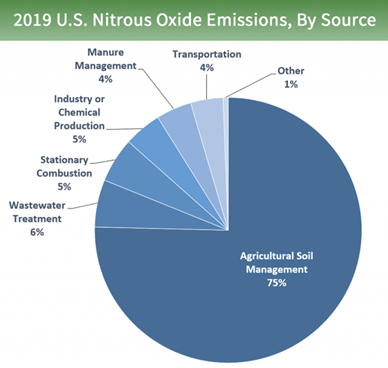
The use of nitrogen fertilizer in agriculture is essential to food production for the growing human population. Nitrous oxide is naturally emitted from soils to the atmosphere. However, high nitrogen input to soils (e.g., fertilizer) and interactions between agricultural management and the soil-crop-atmosphere system lead to an increase in N2O emission rates. Nitrogen additions to croplands is the primary source of N2O emissions in the US (Fig. 2) and globally, with the latter showing an increase of 30% over the past four decades to 7.3 (4.2–11.4) teragrams of nitrogen per year (Tian et al. 2020).
When comparing the potential for heating the atmosphere of a molecule N2O with a molecule of carbon dioxide, the former is about 300 times more effective (Tian et al. 2020). Over the past 150 years, increasing atmospheric N2O concentrations have contributed to stratospheric ozone depletion and climate change (Tian et al. 2020). Despite its important contribution to climate change, N2O emissions have largely been ignored in climate policies (Kanter et al. 2020 and BBC 2021).
Therefore it is of great scientific interest to obtain accurate estimates of N2O emissions. This has been challenging in the past because of, among other reasons, limitations in the sampling of N2O. Nitrous oxide emissions are highly variable, with emissions generally occurring during the growing season but often during short-lived peak emission periods (or “hot moments”), when 50% or more of annual emissions can be released. Other periods of peak emissions can also occur after freeze-thaw events (Wagner-Riddle et al. 2017) and after agricultural management (Scheer et al. 2017), further making it more difficult to measure and estimate.
Hundreds of studies provide observations of N2O emissions (Dorich et al. 2020). However, N2O measurements have traditionally been sparse in terms of duration, where sampling frequency has been found to impact annual estimates (Barton et al. 2015, Reeves and Wang 2015). The lack of access to daily observational data has limited modeling efforts, analysis and understanding of the science behind emissions. Temporal gap-filling is thus necessary to obtain cumulative daily and annual values for N2O emissions, but generally a simplistic linear interpolation has been utilized.
In order to support better estimates of agricultural N2O emissions as well as scientific understanding of the production and mitigation of N2O emissions, the Global N2O Database was created by and is maintained by Rich Conant (NREL & Professor in the Ecosystem Science and Sustainability Department at CSU) and Chris Dorich. The intention is for the database to serve as a repository for the hundreds of sites globally that contribute N2O emission data (Dorich et al. 2020). The Global N2O Database provides a coordinated, sustainable infrastructure that gives researchers data access, and allows for further data contributions. So far data for 71 experimental sites from 5 continents have been contributed to the database, with over half a million rows of daily data. It is expected that ~50 more datasets will be submitted in the coming months. A 2022 EDI Fellow will support publishing those data.
Continued development by the CSU team and participation by the research community will help lead to technical support in terms of analysis tools and new methods, thereby making it easier to compare data across sites or treatments and making the data easily accessible for research.
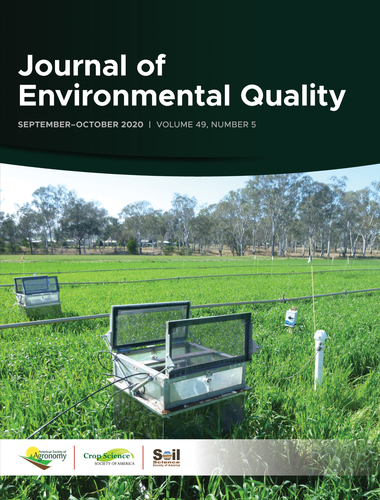
The database thereby becomes a resource for publicly available data that allows analytical advances in terms of gap filling methods and mitigation efforts, among other initiatives. An initial data focus was centered on automated N2O flux chambers (Fig. 3) that sample on a continuous basis and are now used more frequently, as these provide more consistent data sets to work with, opening up the possibility for analysis with data-intensive artificial intelligence methods in an effort to reduce uncertainty in and mitigate N2O emissions. Guidelines for automated N2O chamber measurements were detailed in Grace et al. (2020) as part of a special section of the Journal of Environmental Quality (2020) on “Global Research Alliance N2O chamber methodology guidelines”.
The Global N2O Database is funded by the US Department of Agriculture’s National Institute of Food and Agriculture.
References
Barton, L., Wolf, B., Rowlings, D. et al. Sampling frequency affects estimates of annual nitrous oxide fluxes. Sci Rep 5, 15912 (2015). https://doi.org/10.1038/srep15912.
BBC Future Planet: “The world’s forgotten greenhouse gas.” (2021) https://www.bbc.com/future/article/20210603-nitrous-oxide-the-worlds-forgotten-greenhouse-gas.
Dorich C.D., Conant R.T., Albanito F., Butterbach-Bahl K., Grace P., Scheer C., Snow V.O., Vogeler I., and T. J van der Weerden. Improving N2O emission estimates with the global N2O database. Current Opinion in Environmental Sustainability 47:13-20 (2020). https://doi.org/10.1016/j.cosust.2020.04.006.
Grace P. et al. Global research alliance N2O chamber methodology guidelines: Considerations for automated flux measurement. GRA N2O Chamber Methodology Guidelines. Special Section: Journal of Environmental Quality 49(5) (2020). https://doi.org/10.1002/jeq2.20124.
Kanter D.R., Ogle S.M., Winiwarter W. Building on Paris: integrating nitrous oxide mitigation into future climate policy. Current Opinion in Environmental Sustainability 47:7-12 (2020). https://doi.org/10.1016/j.cosust.2020.04.005.
Reeves S., Wang W. Optimum sampling time and frequency for measuring N2O emissions from a rain-fed cereal cropping system. Sci Total Environ 530:219-226 (2015). https://doi.org/10.1016/j.scitotenv.2015.05.117.
Scheer C., Rowlings D., Firrell M. et al. Nitrification inhibitors can increase post-harvest nitrous oxide emissions in an intensive vegetable production system. Sci Rep 7, 43677 (2017). https://doi.org/10.1038/srep43677.
Tian H., Xu R., Canadell J.G. et al. A comprehensive quantification of global nitrous oxide sources and sinks. Nature 586, 248–256 (2020). https://doi.org/10.1038/s41586-020-2780-0.
Verhoeven E., Pereira E., Decock C., Garland G., Kennedy T., Suddick E., Horwath W., Six J. N2O emissions from California farmlands: A review. Calif Agr 71(3):148-159 (2017). https://doi.org/10.3733/ca.2017a0026.
Wagner-Riddle, C., Congreves, K., Abalos, D. et al. Globally important nitrous oxide emissions from croplands induced by freeze–thaw cycles. Nature Geosci 10, 279–283 (2017). https://doi.org/10.1038/ngeo2907.